
Welcome to The NVI Deep Dive, a new blog series designed to help you explore the data behind the Neighborhood Vitality Index and start having conversations. In each post, we’ll show you how to identify trends and connections that can inform how you engage with and impact your neighborhood zone. Today’s blog asks: Where do people find the information they need to carry out their daily lives? If they need to locate a grocery store near them or the location of their voting precinct where do they turn? And how do the answers to these questions differ by the age, sex, or ethnicity—if they do—of the person seeking the information? The answers to these questions matter if society is concerned with ensuring that residents have the tools and knowledge to live effectively in their environment. The answers also matter to individuals and organizations attempting to impart this knowledge. Publishing newspaper articles about voting precinct locations will not be helpful if residents do not read newspapers.
In the section on digital information, the NVI questionnaire asked, “[P]eople can turn to a variety of sources to get the information they want or need. If you wanted information about these [eight] topics [listed below], where would you look?” The questionnaire contained a matrix listing the eight topics and six sources of information (television; radio; newspapers; social media; online searches; and friends and neighbors, etc). Respondents were asked to indicate for each of the eight topics which sources they would turn to for information about that topic. For each topic respondents could select multiple sources.
| Television | Radio | Newspaper | Social Media | Online Research | Friends, neighbors, etc. | |
|---|---|---|---|---|---|---|
| Local Politics | □ | □ | □ | □ | □ | □ |
| Grocery Stores | □ | □ | □ | □ | □ | □ |
| Community Events | □ | □ | □ | □ | □ | □ |
| Medical Facilities | □ | □ | □ | □ | □ | □ |
| Churches | □ | □ | □ | □ | □ | □ |
| Job Openings | □ | □ | □ | □ | □ | □ |
| Weather | □ | □ | □ | □ | □ | □ |
| Transportation | □ | □ | □ | □ | □ | □ |
This analysis is intended to provide a preliminary look at differences in sources by the respondents’ ages and to assess whether analysis by additional respondent characteristics would likely yield insights. The investigation divided respondents into three age groups: 18-34, 35-54, and the focus of this analysis, 55 or older. The NVI sample is not a random sample and contains some biases. We know, for example, that men were underrepresented in the sample. Nonetheless, the NVI is a rich source of findings that can stimulate discussions that further our understanding of a topic.
For each of the six sources there is a table showing the percentage of the sample citing that medium as a source of information on the eight topics. For example, the table below gives the percentage of the sample citing television as the source of information about local politics, grocery stores, and so on for each of the three age groups. The percentages highlighted blue are substantially higher or lower than the percentages preceding or following it.
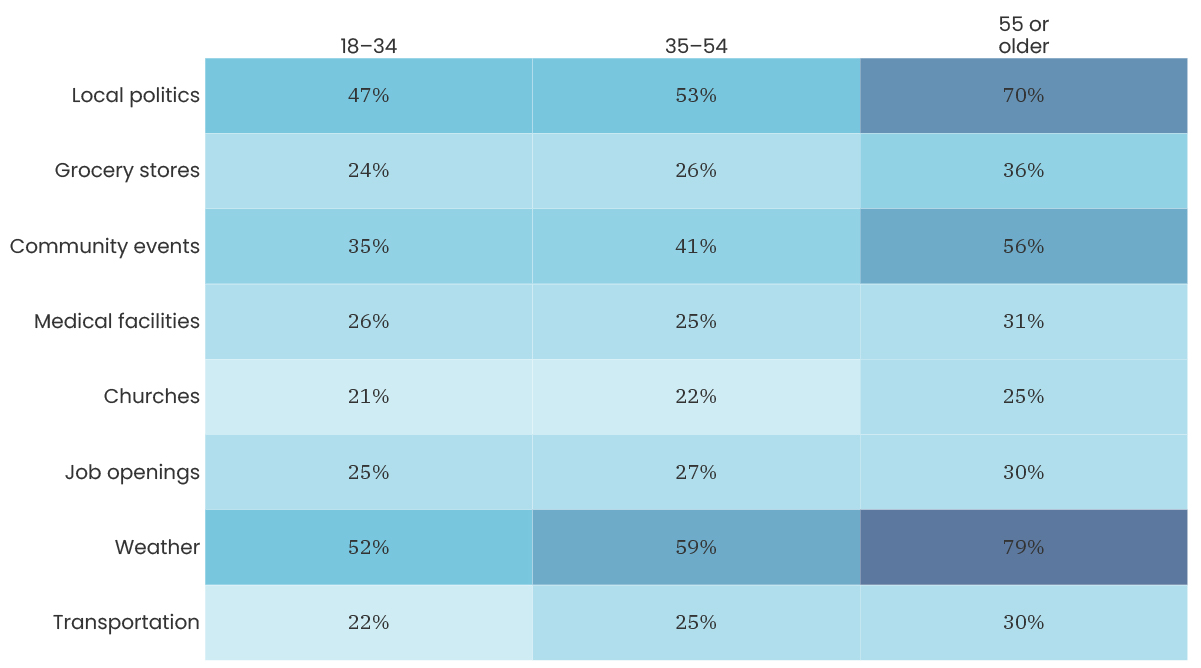
For respondents in the three age groups television was a major source for local politics and weather and to a lesser extent, community events. Seniors (aged 55 or older) stood out from younger respondents in turning to television for information about local politics and the weather.
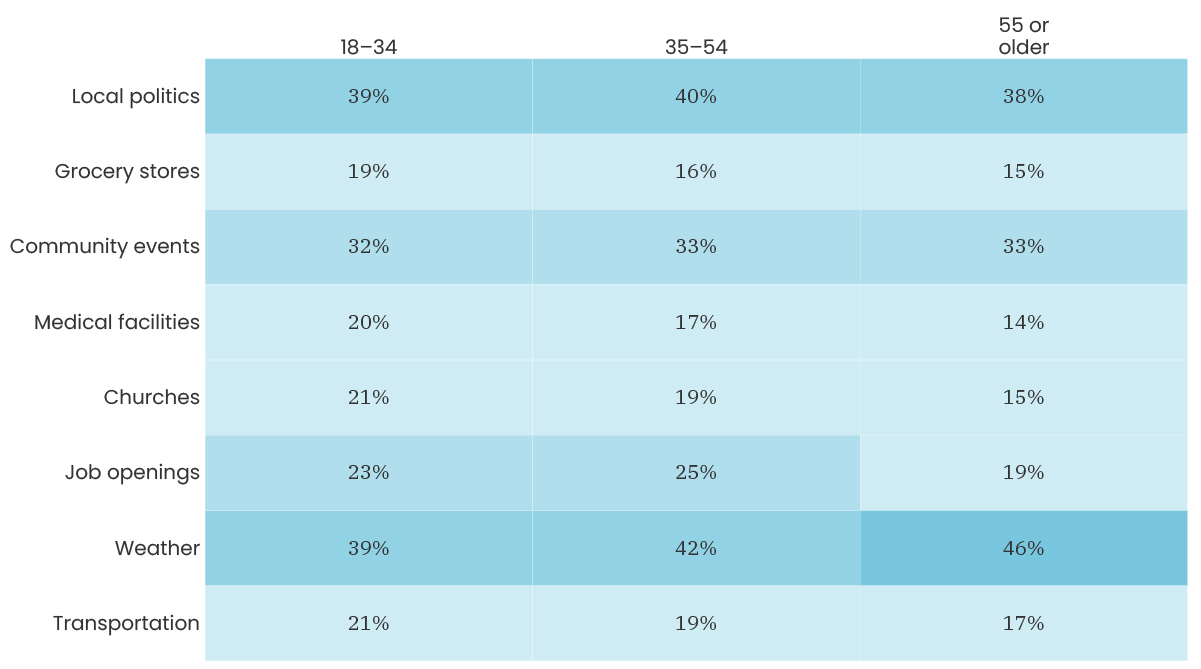
Seniors were not markedly different from younger respondents in their use of radio as a source of information.
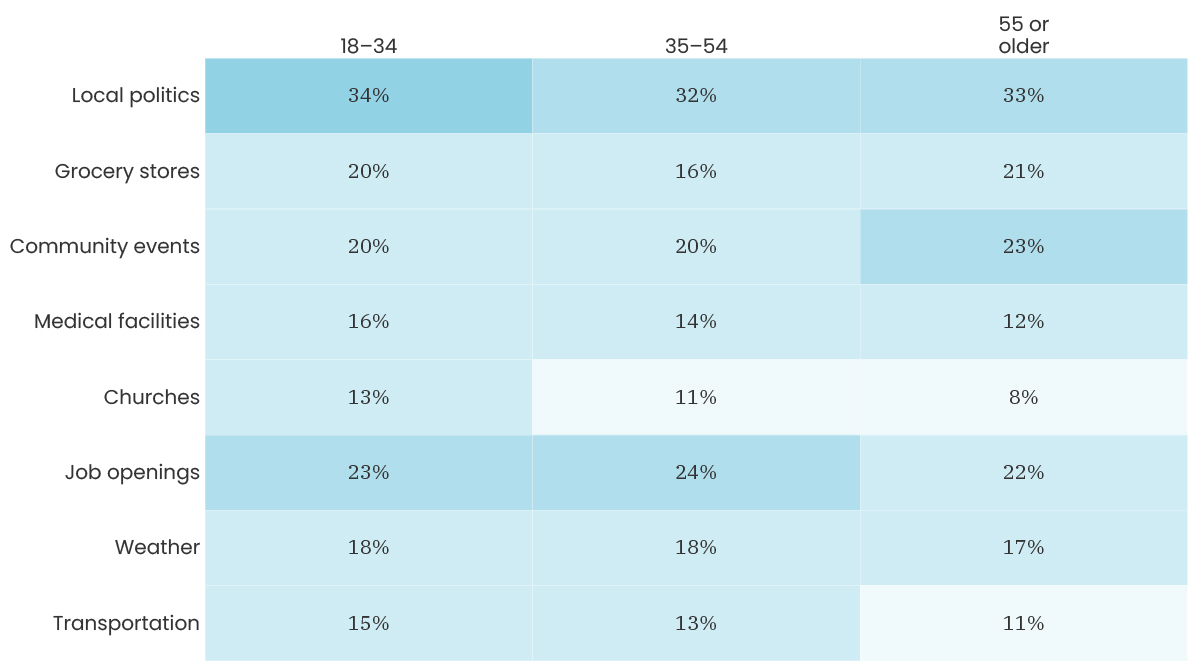
Newspapers, too, were not mentioned as major sources of information for any of the three age groups.
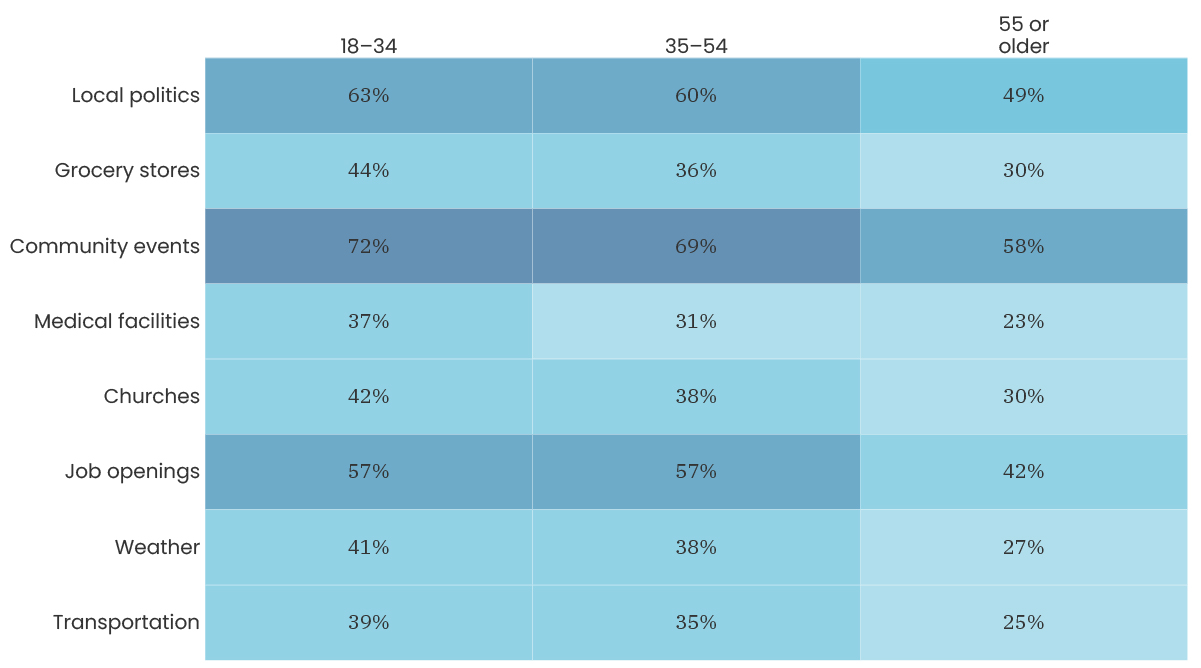
The most striking aspect of the table citing the percentages of respondents checking social media as a source of information is that on all the topics seniors were far less likely to credit social media as a source of information compared to younger respondents.
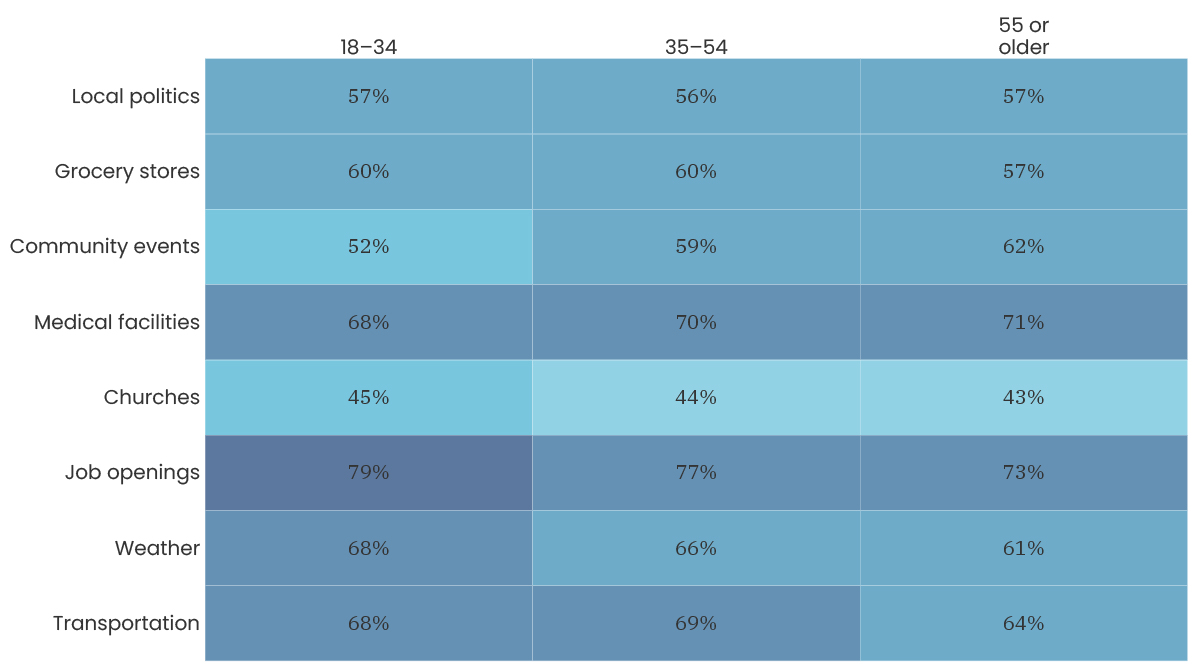
In contrast to social media, online searches by people aged 55 or older were checked about as frequently as they were by respondents aged 18-54.
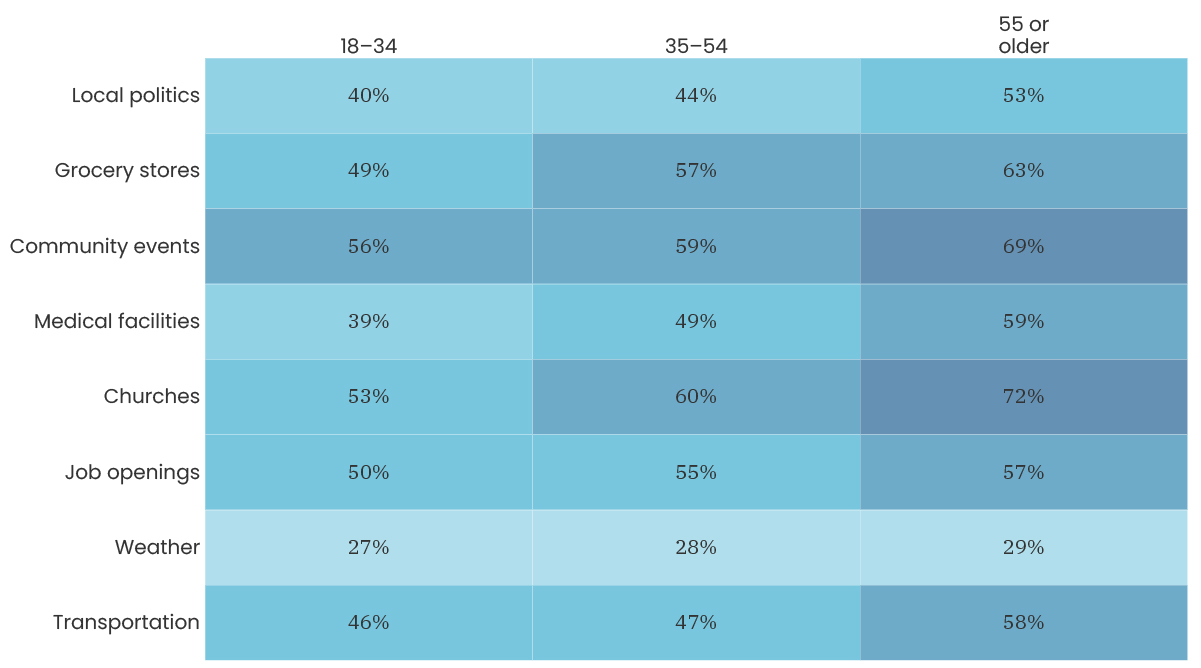
It was when the questionnaire asked about friends, neighbors, etc., that residents aged 55 and older stood apart from the two younger groups. Personal connections were especially influential as sources of information for seniors about churches and community events but also for grocery stores, local politics, medical facilities, and transportation. Interestingly, the importance of these personal connections increased even further as age increased.
For more information about how digital equity impacts Detroit residents, check out the Digital Equity Hub, a project the City of Detroit and D3 published in 2025.