
Whether NVI data is representative is a complicated question, and it doesn’t have a simple yes or no answer. When we talk about “representative” data, what we really mean is this: do we believe the survey responses we collected would look similar if every Detroiter took the survey? In this case, the answer is yes—with a few limitations to keep in mind. At the citywide level and across City Council Districts, the data provides a useful picture of how Detroiters might respond overall. At the neighborhood zone level, representativeness varies, but the data can still provide helpful insights.
It’s also important to acknowledge that some groups were more likely to take the survey than others. This means, the people who took the survey in 2025 do not perfectly mirror Detroit’s population as a whole, so if we are using the data to make decisions, we should remember where the data might not represent every voice equally.
A sample is a smaller group of people selected from a larger population to participate in a survey or study. Instead of asking everyone, we are only able to ask a portion of the larger group, then use their responses to make educated guesses about the whole population. When thoughtfully designed, a sample can provide reliable insights, which saves time, money, and effort while still helping us understand the bigger picture.
Sample size, the number of people included in a survey or study, plays a key role in understanding if the results are reliable and accurate.
We want to know how many people we need to answer a question to be confident that if we did ask everyone in Detroit the same question, we would get similar results. This is where sample size comes in.
When we compare sample sizes to the population size, we can estimate how accurately our survey results reflect the entire population’s opinions. These comparisons happen through different calculations that tell us how much confidence we can have that NVI results represent the entire City of Detroit.
Two important tools help us make this assessment: the margin of error (MOE) and the confidence interval.
In short, the sample size, or number of people who completed the survey, determines the size of the margin of error and confidence interval. Together, these measures help us estimate how accurate survey findings are likely to be.
Larger samples generally lead to more precise estimates, but there’s a point where it doesn’t make sense to continue to collect surveys. After a certain size, adding more responses doesn’t significantly improve accuracy, but it does increase time and cost for outreach. That’s why surveys aim for a sample that’s just large enough to provide reliable results without wasting resources. For more about these reliability measures, check out Data Driven Detroit’s blog post or this video.
For each council district and neighborhood zone, we calculated the sample size needed to meet certain confidence intervals and margins of error based on the overall population in each place. In the table below, you can see which ones met the threshold. Overall, the number of surveys collected in each 2025 council district met the threshold of a 95% confidence interval and 5% MOE. Twenty neighborhood zones meet the threshold for an 80% confidence interval and 5% margin of error, two zones did not meet the threshold.
| Council District | Surveys Collected | Surveys needed to meet a 95% confidence interval with 5% margin of error | Did we meet the 95% confidence interval with a 5% margin of error threshold? |
|---|---|---|---|
| 1 | 1,010 | 383 | Yes |
| 2 | 989 | 383 | Yes |
| 3 | 666 | 383 | Yes |
| 4 | 1,076 | 383 | Yes |
| 5 | 1,130 | 383 | Yes |
| 6 | 1,004 | 383 | Yes |
| 7 | 829 | 383 | Yes |
| Neighborhood Zone | Surveys Collected | Surveys needed to meet a 80% confidence interval with 5% margin of error | Did we meet the 80% confidence interval with a 5% margin of error threshold? |
|---|---|---|---|
| 1a | 392 | 164 | Yes |
| 1b | 207 | 163 | Yes |
| 1c | 411 | 164 | Yes |
| 2a | 417 | 164 | Yes |
| 2b | 281 | 163 | Yes |
| 2c | 291 | 163 | Yes |
| 3a | 293 | 164 | Yes |
| 3b | 264 | 163 | Yes |
| 3c | 109 | 163 | No |
| 4a | 414 | 164 | Yes |
| 4b | 343 | 163 | Yes |
| 4c | 319 | 163 | Yes |
| 5a | 421 | 164 | Yes |
| 5b | 332 | 163 | Yes |
| 5c | 377 | 164 | Yes |
| 6a | 339 | 164 | Yes |
| 6b | 320 | 163 | Yes |
| 6c | 232 | 163 | Yes |
| 6d | 113 | 162 | No |
| 7a | 308 | 164 | Yes |
| 7b | 177 | 163 | Yes |
| 7c | 344 | 163 | Yes |
However, we cannot say that our survey is representative based on these numbers alone. Additional factors, called assumptions by statisticians, must also be true. In our case, we know that we don’t always meet those assumptions, and we want to ensure that we are letting people know about those limitations.
All the calculations we’ve discussed—sample size, margin of error, confidence intervals—are based on an important assumption: that a sample is random. A truly random sample means that every person in the population had an equal chance of being selected to take the survey. When that’s true, we can feel confident that our results reflect the broader group.
In reality, it’s hard to get a perfectly random sample, especially when doing community-based or opt-in surveys like ours. Most people who saw our survey likely had internet access and had previously signed up to receive emails from an organization, agency, or newsletter. This means our responses are not random and may over-represent certain types of people, especially those more digitally connected and inclined to take surveys.
To try and counteract this bias, we took additional steps to promote the survey at in-person events, made it available on paper, and sent random outreach emails to increase reach beyond our usual circles. These steps helped, but they didn’t eliminate the issue.
While we can still learn a lot from this data, it’s important to be transparent about the fact that our sample isn’t completely random. This affects how confidently we can say our findings apply to the whole population and not just those who participated in the survey.
After looking at our sample size and potential sources of bias, the next step is to examine how well the people who took the survey match the broader population. One way we assess this is by comparing the demographic characteristics of survey respondents (sex, age, and race) to the known demographics of the areas where they live.
For example, we know from broader research that women are more likely than men to take surveys. As a result, our data may reflect women’s experiences more than men’s, simply because women were more likely to respond. This is called oversampling, and while it’s common in community surveys, it’s still a limitation we need to acknowledge.
This analysis doesn’t fix the imbalance, but it gives us valuable insight into the strengths and limitations of the data as well as helping to guide future improvements in data collection and engagement.
In the tables below, we look at how closely the makeup of our sample aligns with the population in different geographies across the city, such as council districts and NVI Neighborhood Zones. This comparison helps us understand where our data may be more or less representative. If certain groups are consistently over- or underrepresented in particular areas, it may suggest a need for caution in interpreting results from those places.
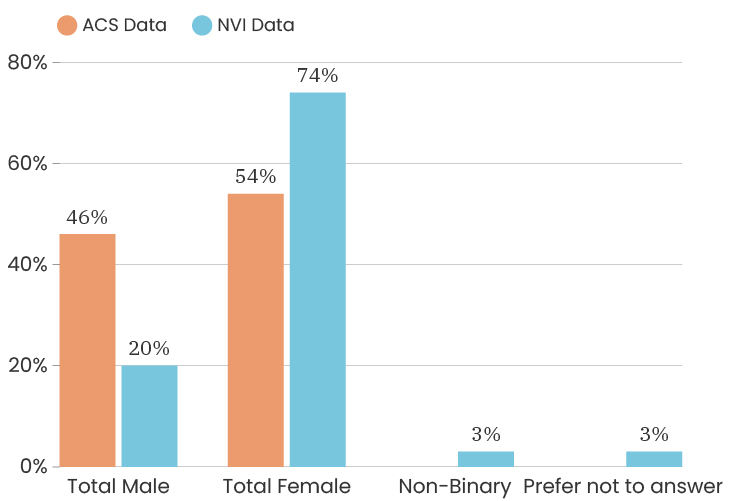
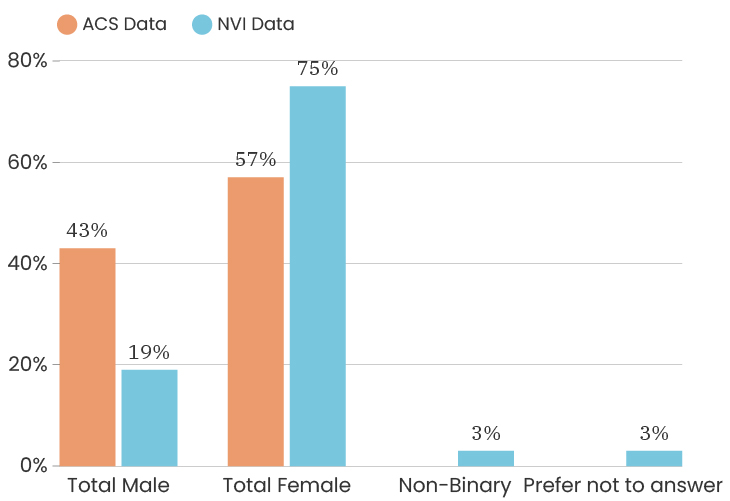
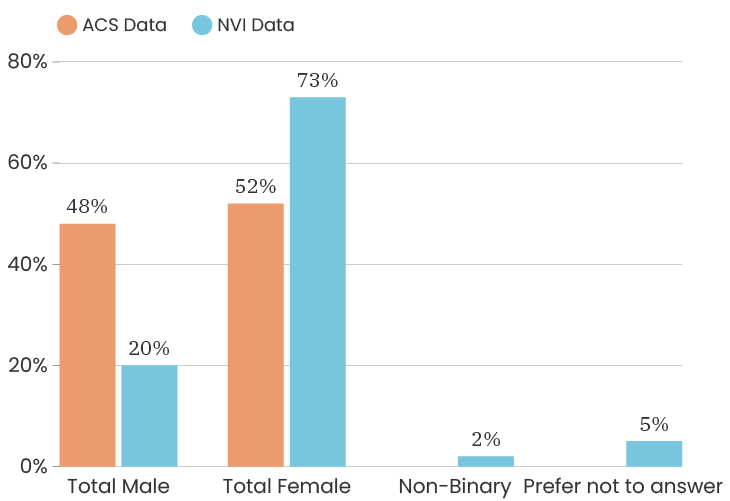
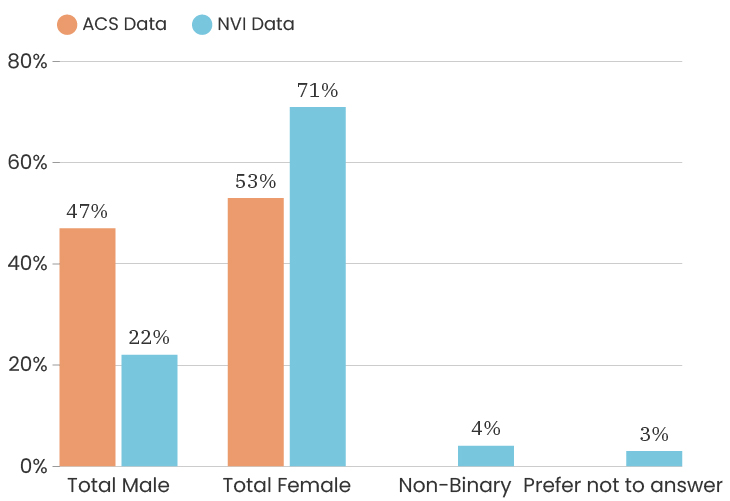
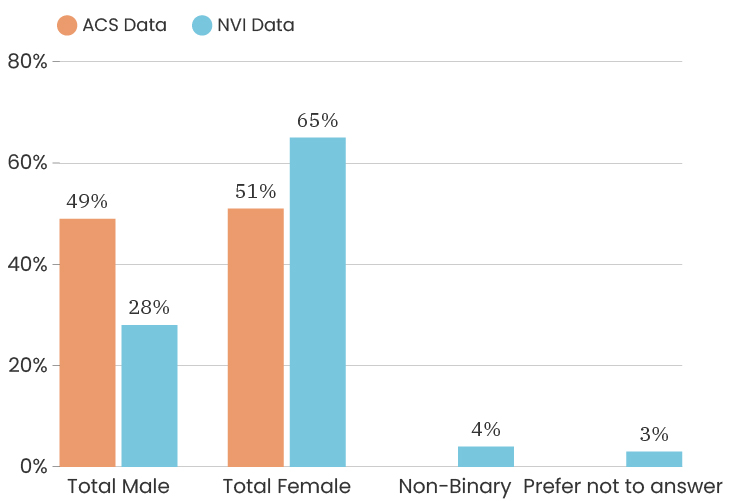
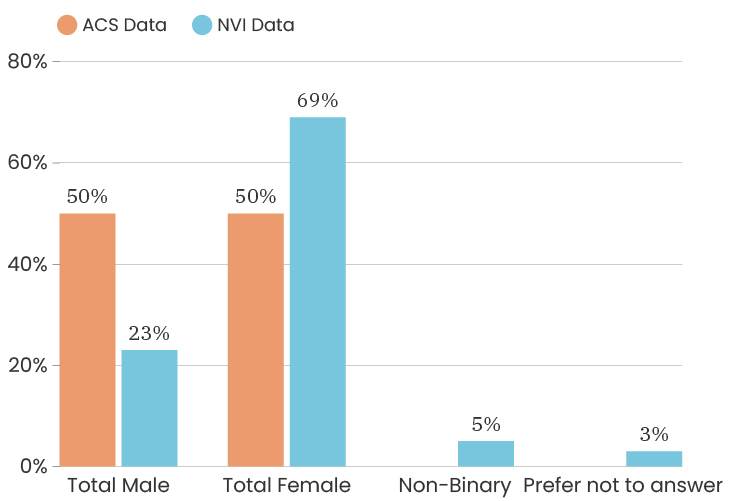
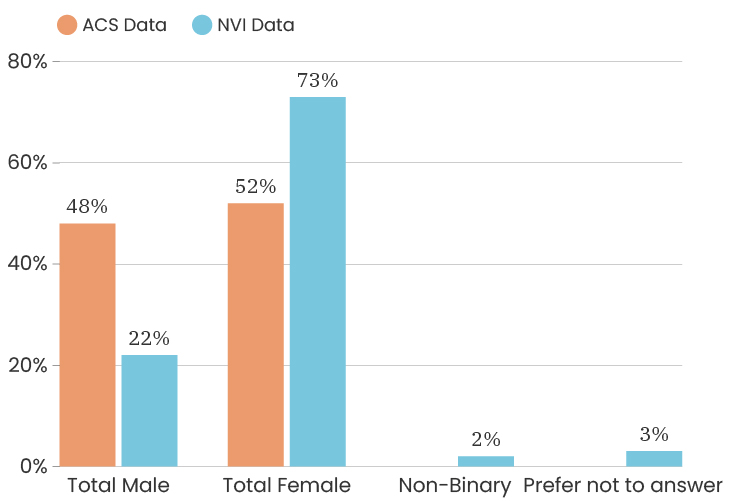
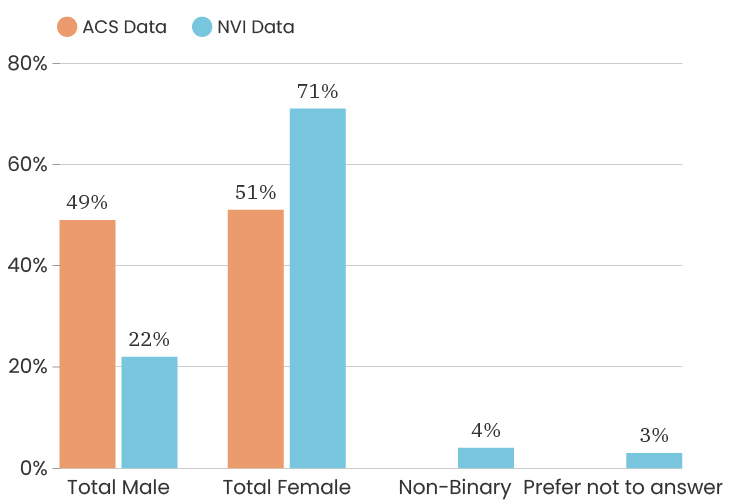
When we look at the gender of people who took the 2025 survey Citywide, we see that the city as a whole is 47% male and 53% female. This is according to the American Community Survey, which is also a representative sample of the population. (For margins of error, you can check out D3’s State of the Child tool.) The people who answered our survey were 71% female, 22% male, 4% non-binary, and 3% preferred not to answer. This means that women are over-represented in our sample. One thing we can do is to look at the impact of gender on a survey answer, which means that we recalculate that indicator twice, once using only female respondents and once using only male respondents. This allows us to determine how much or how little the gender difference impacts that particular indicator. To see the male/female gender breakdown by council district and citywide, see the charts below.
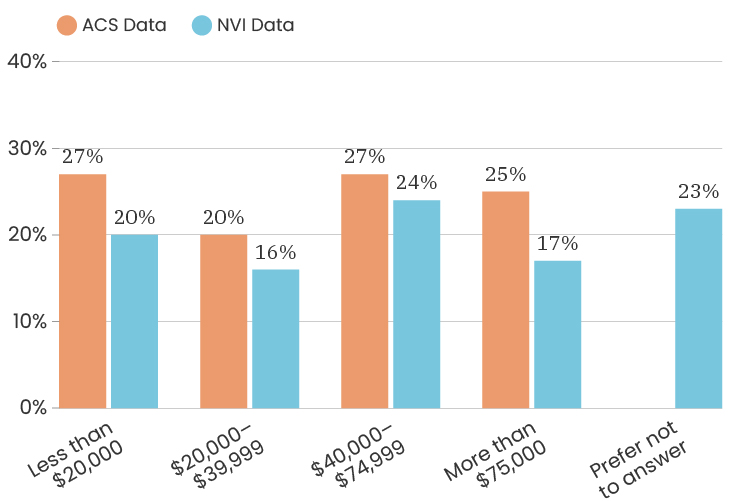
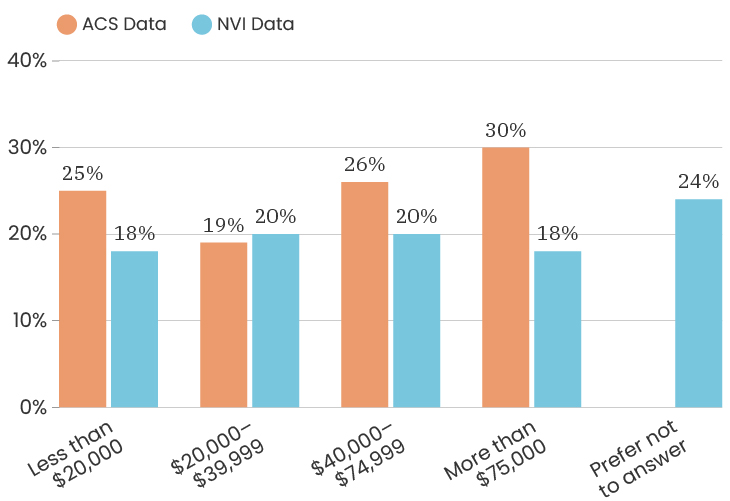
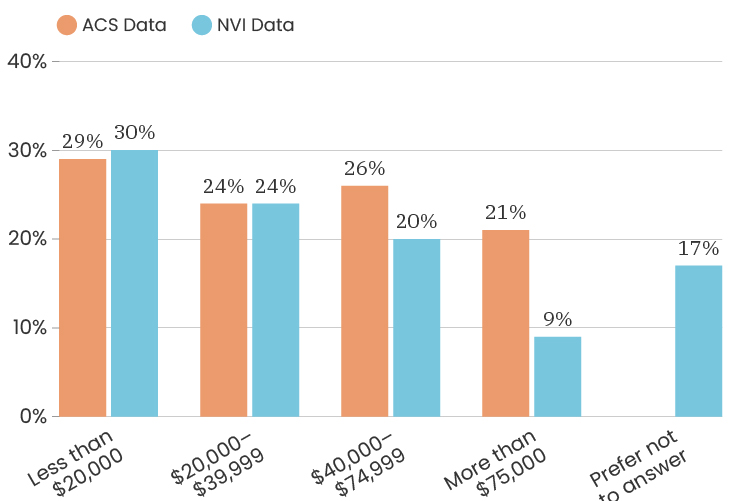
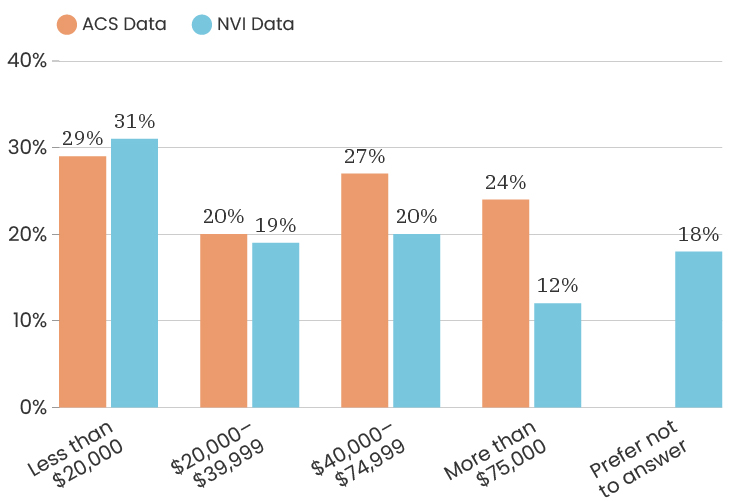
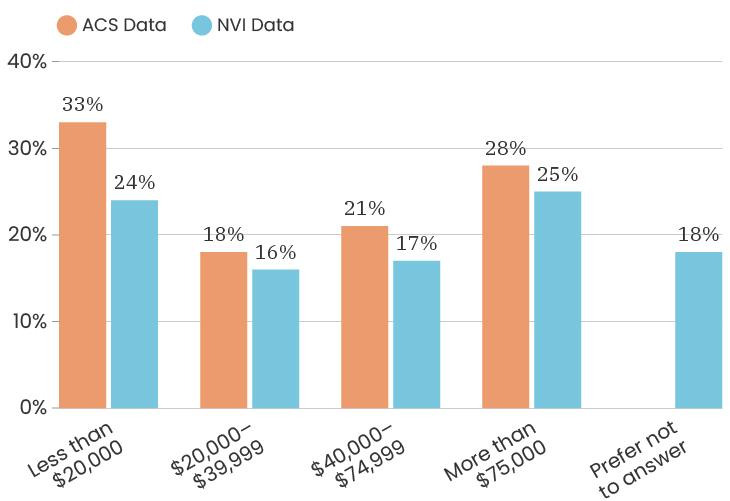
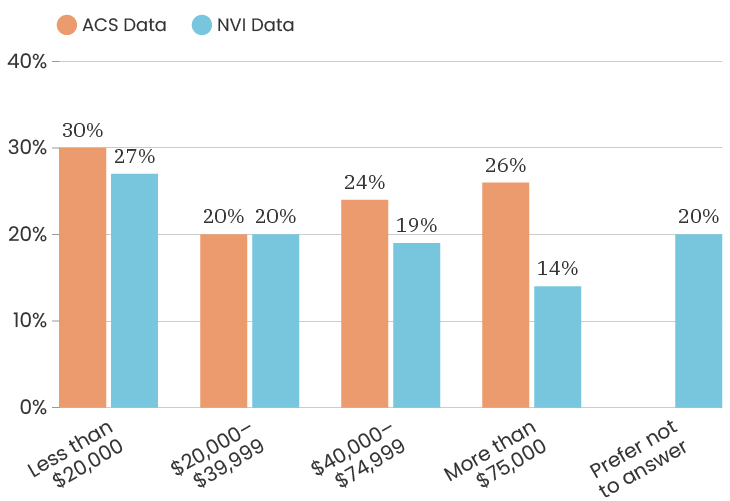
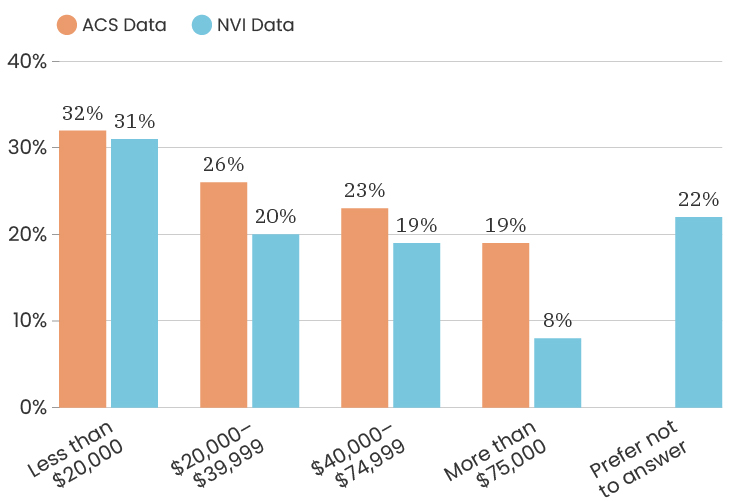
Citywide, the ACS data has median income of $39,947. The people who took the NVI survey had a median income of $37,100, which puts us below the city’s 2025 median income (and we are outside of the MOE). It is important to note that a significant number of respondents preferred not to answer questions regarding income, which was not an option in the ACS, and could skew the NVI results in a myriad of directions.
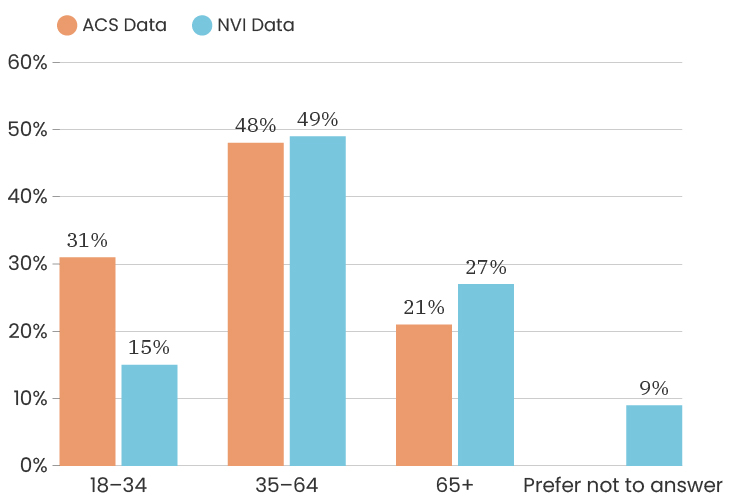
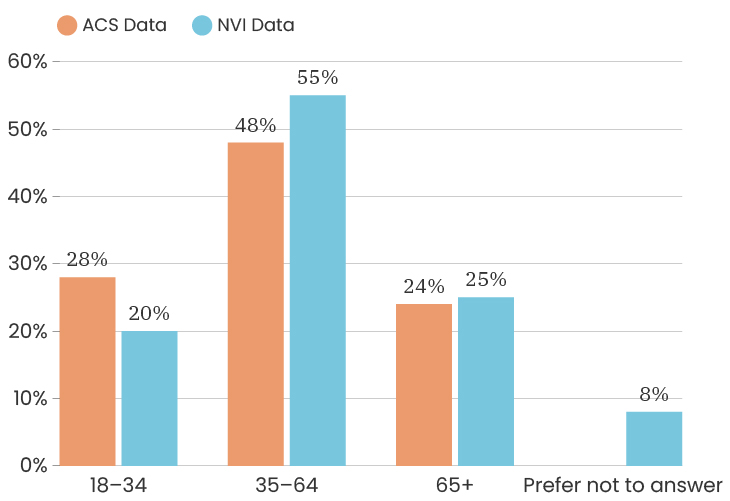
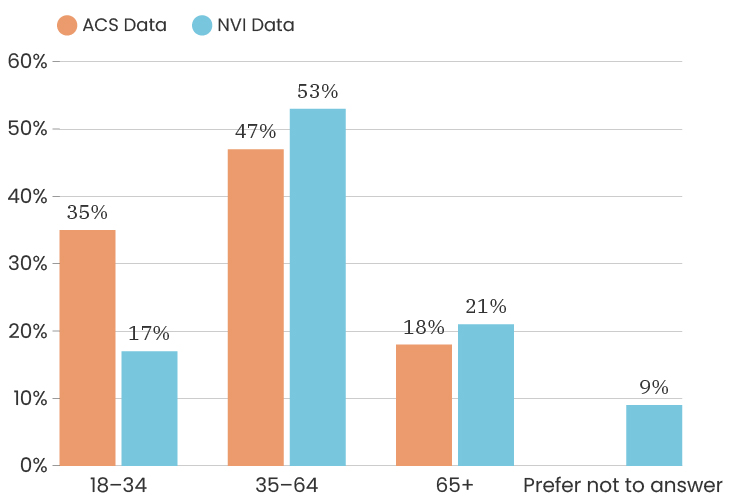
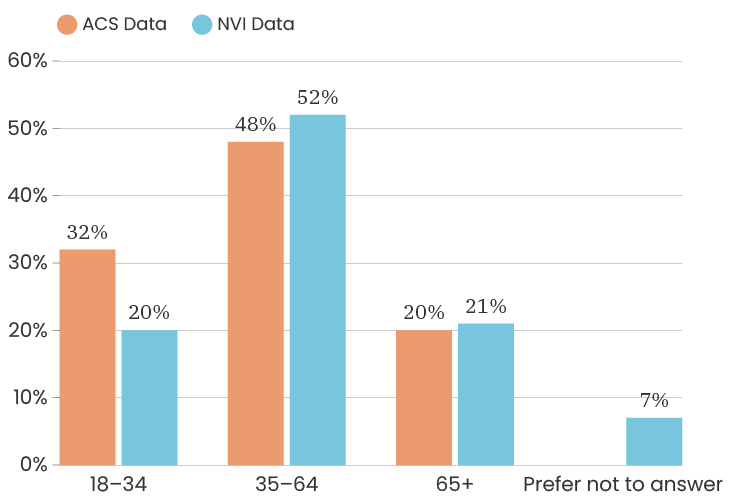
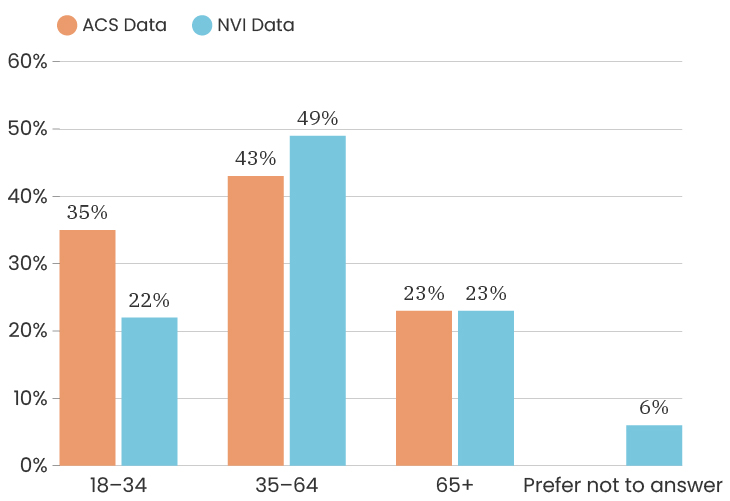
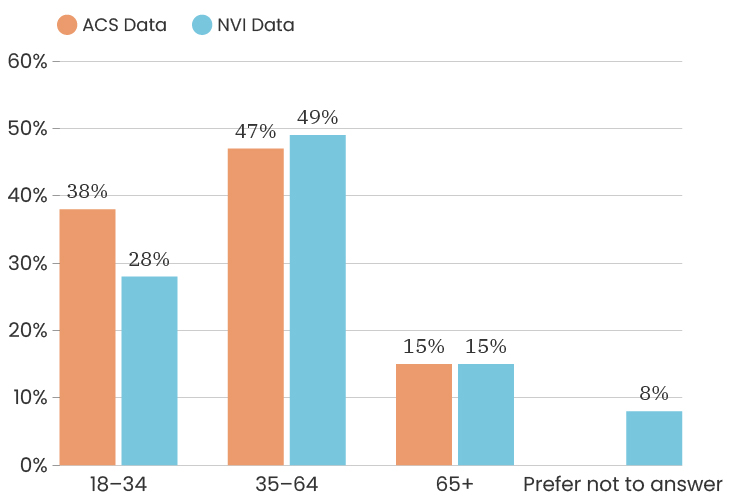
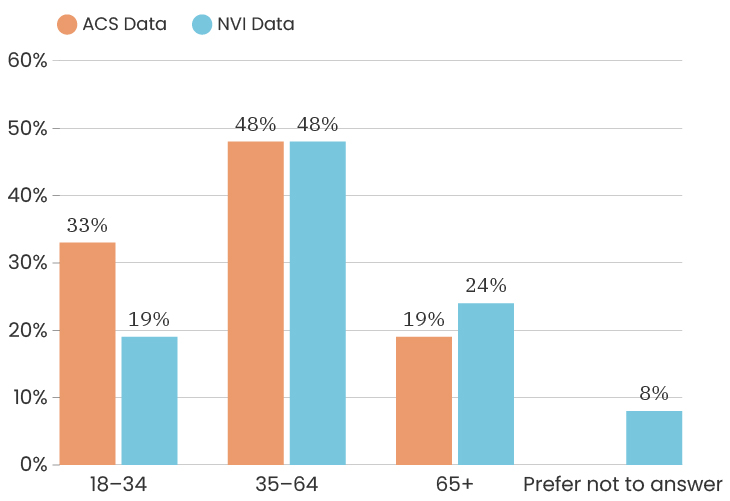
The median age in Detroit is 35 years old. The median age of the people who took our survey is 51 years old. This means that people over the age of 51 are over-represented in our sample. Similarly to the way we treat gender, we can look at the impact of age on a specific indicator, meaning we recalculate that indicator twice, using only respondents under 54 and again using only respondents over 55. This allows us to determine how much or how little the age difference impacts that particular indicator. To see the age breakdown by council district, you can look at the charts below.
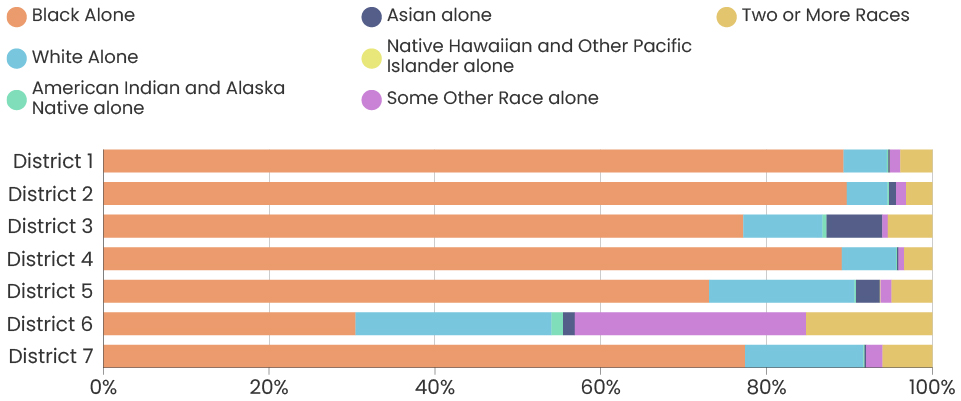
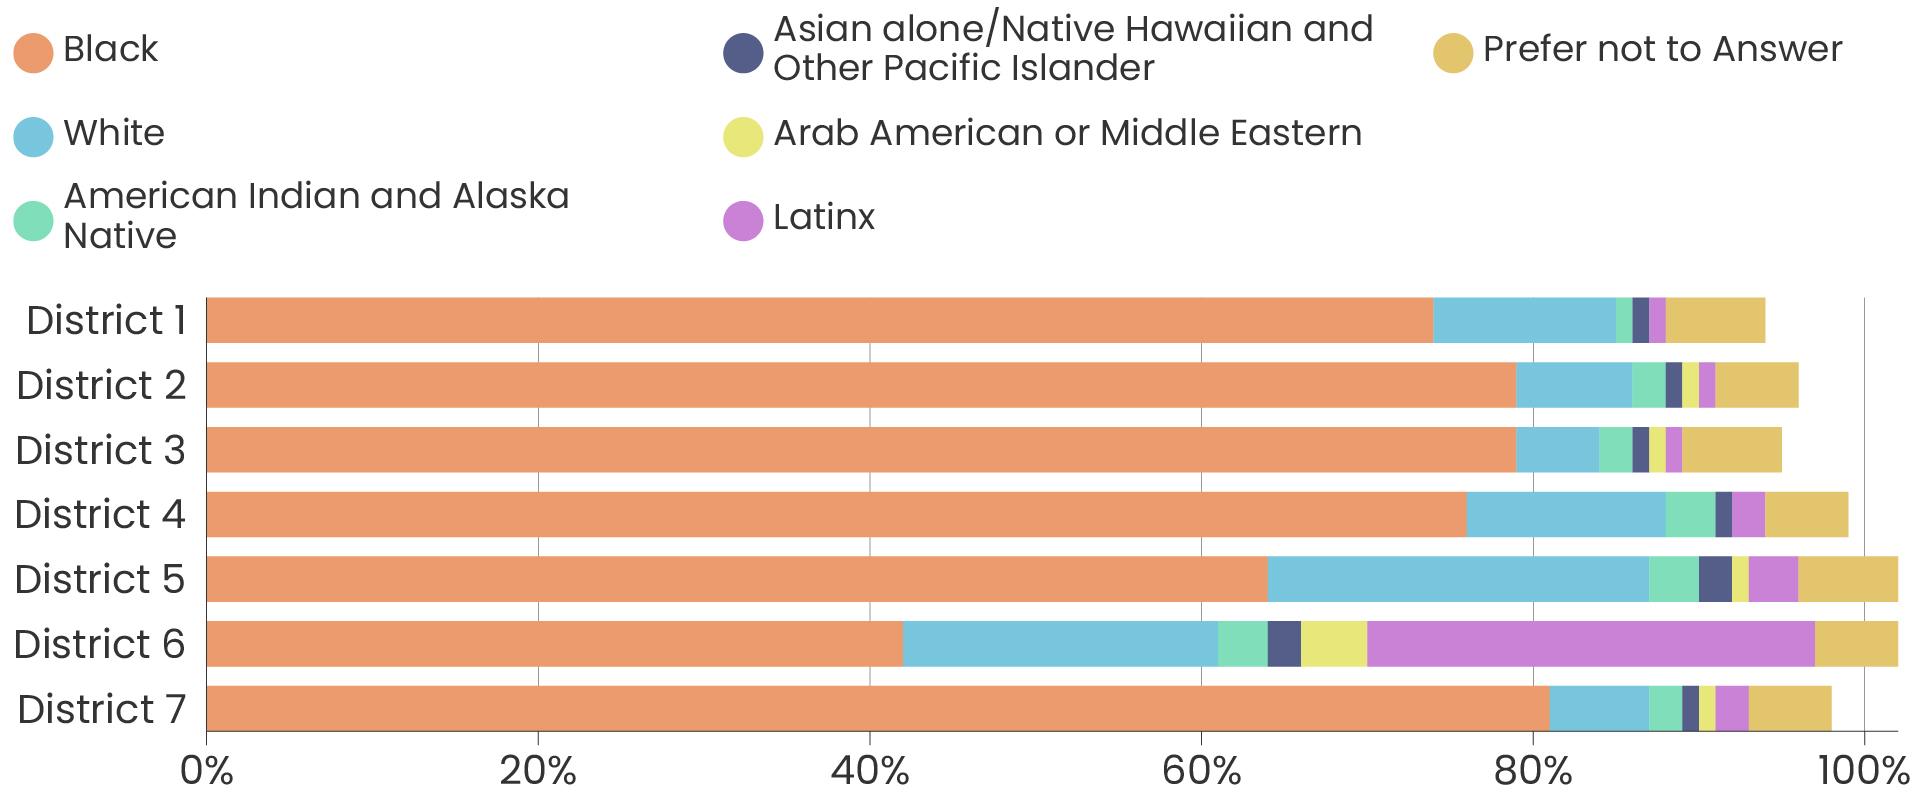
It is well-documented that the federal guidelines for collecting race/ethnicity data are not sufficient for identifying some groups of residents, especially Arab American or Middle Eastern. There are new recommendations that the census and other federal data collection projects add in these categories, so when NVI collects data from these groups, they will provide enhanced granularity by influencing the responses of some who otherwise might identify as White or Some Other Race. Also, due to the survey design, we were not able to report Asian, Native Hawaiian, or Other Pacific Islanders separately within the 2025 data. We are, however, reporting them combined below to give visibility to that demographic within the NVI sample. Because of factors like these, it isn’t possible to fully compare race/ethnicity data between the ACS and the NVI, though we have made some efforts to standardize the data as much as possible and highlight areas where the NVI sample most closely resembles Detroit’s overall demographics.
Note that the ACS race/ethnicity data may not total 100% due to round, and the 2025 NVI survey used a “select all that apply” approach to identifying race/ethnicity, so numbers add up to more than 100%.
So, back to our initial question, is this data representative? The answer is: it’s complicated. For now, we consider the data representative enough to be useful for recognizing trends and patterns across Detroit, but it should be used thoughtfully and with awareness of its limitations. We continuously conduct thorough checks to better understand how these imbalances influence our results and share our findings.
As we work with our partners to make the NVI survey responses even more reflective of Detroiters, the NVI data will get more and more representative of the city, allowing us, along with community stakeholders, to guide the next wave of neighborhood investments. Reach out if you want to help! If you want to talk to someone at D3 about how you plan to use the data and what you might want to consider, feel free to ask us by reaching out via our contact page.